
Master Spark fundamentals & optimizations
Streamhub’s all-in-one notes on how to optimize & scale Spark jobs for something more than a POC

At Streamhub, we deal with many forms of data like user’s (every minute) player viewership data, user’s commerce data, user’s subscription information, metadata feeds, metadata front-loaded, user panels, and several other third-party datasets. It is easy to imagine the amount of work required to unify these various forms of data from various sources and ingest them into our ecosystem and making them richer, standard and useful to our clients. At some point, we were running hundreds of jobs daily, crunching over terabytes of data to support our extensive use-cases. All this heavy lifting is done by Apache Spark running over AWS Elastic MapReduce, in the Yarn mode.
In the last two years, we have learned massively about how to optimize Spark jobs over EMR. Writing your first job in Spark might take a day or two but learning to tune Spark takes months if not years. This article was initially created as internal team notes which I am now publishing hoping more people can benefit from it. This covers almost everything you should know to run your Spark jobs efficiently (on EMR/Yarn but covers general aspects as well) which comprises of performance optimizations, resource allocations, cost reductions, understanding important concepts, common mistakes in coding/configuring jobs, common exceptions and some must-reads/watch about Spark we have found over time. Right, literally everything!
This article will touch upon the following topics:
EMR Instance-types: Understand your workload and use specialized instances
EMR Purchasing options: choose the right option to optimize cost for your use-case: Spot or Spot Fleet or Spot blocking
Resource utilization: Configure your spark cluster to fully use your resources
— Static resource allocation
— — Understanding Spark’s memory usage is important
— Dynamic resource allocation
GC Tuning
Bad code and related problems
— Avoid shuffle
— Some preferred methods: ReduceByKey over GroupByKey
— Avoid serialization of the whole object
— Operations reordering
— Improve Joins
— — Using Broadcast variable (Joining very large datasets with a relatively small dataset)
— — Using filters pre-join (Joining very large datasets with a mid-sized dataset)
Degree of parallelism
— Repartition
— Coalesce
More on partitioners
Choice of serializer
Dedicated Spark local directories
Writing to databases
Data storage formats: Parquet, ORC, Databricks Delta & compression options
Caching intermediate datasets
Use higher-level APIs: Dataframes/Datasets
This article was originally on Medium, in case you find this format is easier to read: https://medium.com/@sambodhi_72782/spark-tuning-manual-47b98ccb2b2c
Reducing your processing cost is important, also because lower is the cost, better resources you can get for your spending and lower effort you have to make in improving the performance.
Instance-types: Understand your workload and use specialised instances
- ML mostly CPU intensive, ETL mostly IO intensive
- Spark is incredibly memory intensive, we use memory optimized instance types like r4 or newer r5 family instances.
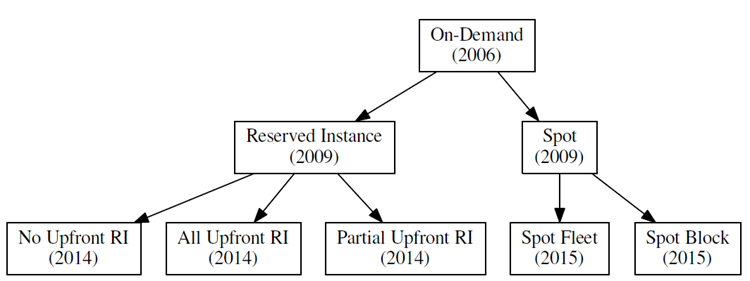
Purchasing options: choose the right option to optimize cost for your
use-case: Spot or Spot Fleet or Spot blocking
- Spot: Spot instances can help reduce your EC2 costs by 40–80%.
- Spot Fleet: The advantage of using a Spot Fleet is that instead of specifying the instance types you want, you can specify your computing and memory capacity requirements. Also, you can specify multiple subnets/availability zones. AWS will provide the available instances which fulfill that requirement. This profoundly increases your chance of getting Spot Instances.
- Spot Block: Spot Instances with a specified duration are designed not to be interrupted and will run continuously for the duration you select. AWS charges more for blocking, but still much less than on-demand. You can also specify the duration for which it will continue to look for spot instances before switching to on-demand instances.
Good reads:
https://docs.aws.amazon.com/AWSEC2/latest/UserGuide/spot-requests.html#fixed-duration-spot-instances
https://aws.amazon.com/blogs/aws/new-ec2-spot-blocks-for-defined-duration-workloads
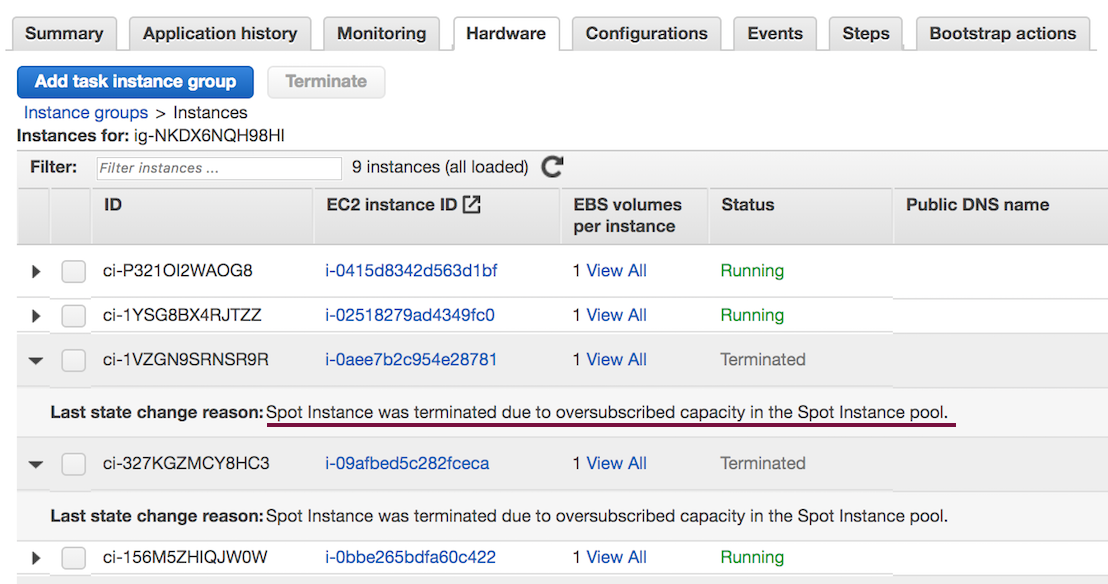
A common problem we noticed related to this was instances being blacklisted from cluster or cluster resizing unexpectedly. It is more common to see this in long-running jobs when it tries to reacquire the instances and causing the tasks/jobs to fail, which after a couple of retries may lead to this. You can see the instances blacklisted in Spark console and you can check EMR console if see if the problem was due to instances being unavailable:
Resource utilisation: Configure your spark cluster to fully use your resources
Static resource allocation
When you configure your cluster, to fully utilize your resources ensure the following equation holds true:
M = spark.executor.memory + spark.yarn.executor.memoryOverhead (by default 0.1 of executor.memory) < container-memory.
Where ‘Container memory’ is the amount of physical memory that can be allocated per container. According to Cloudera documentation, when running Spark on YARN, each Spark executor runs as a YARN container. Multiple executors (and therefore containers) can run in one instance, where M cannot be less than yarn.scheduler.minimum-allocation-mb or more than yarn.scheduler.maximum-allocation-mb and sum M for all executors/containers on a single host cannot be more than yarn.nodemanager.resource.memory-mb.
Exceptions related to this — INFO Client: Verifying our application has not requested more than the maximum memory capacity of the cluster java.lang. IllegalArgumentException: Required executor memory (17408), overhead (1740 MB), is above the max threshold (12288 MB) of this cluster! Please check the values of ‘yarn.scheduler.maximum-allocation-mb’ and/or ‘yarn.nodemanager.resource.memory-mb’. If you are on the EMR version before 4.1.0, there are more chances to see this error. Why? Because before this certain instance type had yarn.scheduler.maximum-allocation-mb set to a lower value than yarn.nodemanager.resource.memory-mb. So for certain configurations like maximizeResourceAllocation, it might try to use all the available memory in which case it would hit the max threshold. With release 4.1.0, AWS fixed this to make yarn.scheduler.maximum-allocation-mb equal to yarn.nodemanager.resource.memory-mb which fixes this problem. You can check the values of these configuration parameters for different instance types here.
Easier to understand with an example –
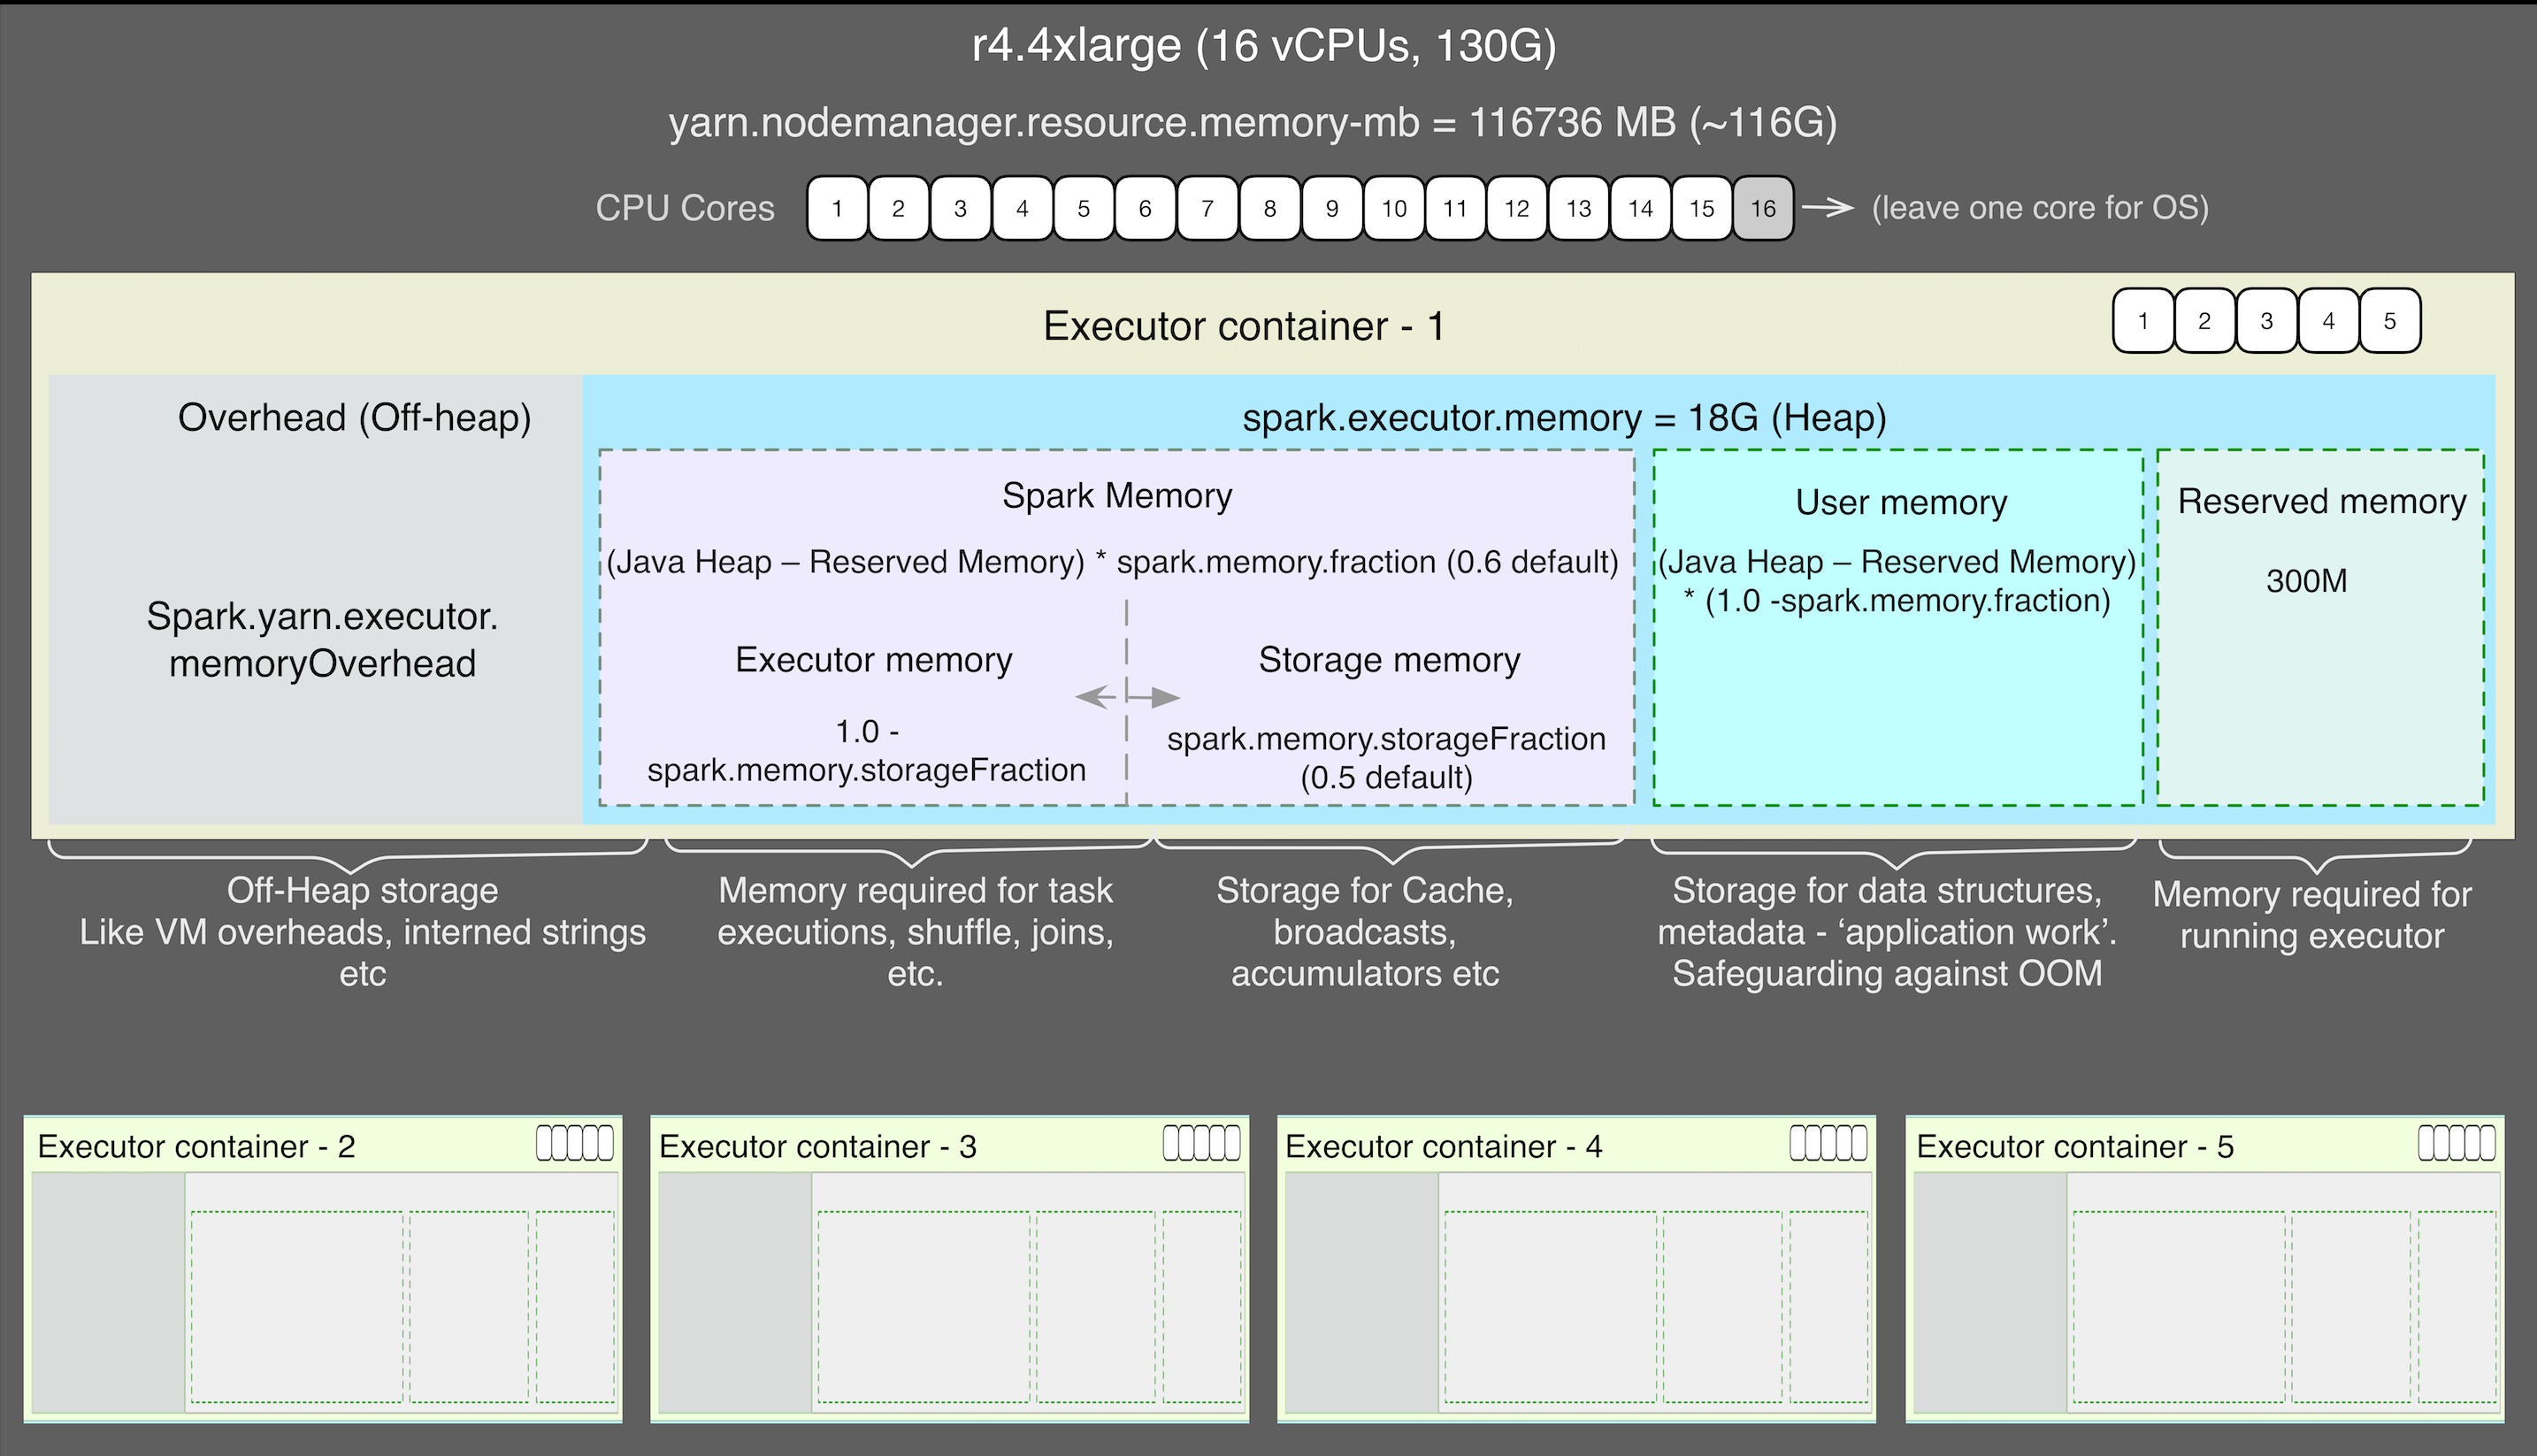
- Let’s say we are using r4.4xlarge instances with 16 vCPUs, 130 GB RAM but available memory for containers is 116736 MB.
- Leave one core for the OS and let’s say we set the number of executor-cores as 3 (16–1 = 15).
- Calculate the number of executors: Number of executors per instance = (total number of virtual cores per instance — 1) / executor-cores with 3 cores per executor, we can have 5 executors-per-instance (16–1) / 3 = 5. So if our cluster has 4 instances, num-executors (in cluster) = 5 * 4 = 20.
- Set spark.executor.memory 18 GB. Therefore, in our case: (18 + (0.1 * 18)) * 5 = 99GB < 116736MB (container memory)
This is just an example of how you can configure your cluster to make maximum utilization of the resources, obviously, there are many different configurations possible. You need to experiment with them and see what works best for your application.
Understanding Spark’s memory usage is important
Memory usage largely falls into two categories: execution and storage. Few points to grasp to understand the memory model:
M = spark.executor.memory + spark.yarn.executor.memoryOverhead (by default 0.1 of executor.memory) < container-memory.
Where M is the unified shared memory between execution and storage. The default value of spark.memory.fraction is 0.6 or 60%
The rest of 40% memory is used as ‘user memory’ reserved for user data structures, internal metadata, etc
M = execution memory + storage memory
Execution memory <= M * (1 — spark.memory.storageFraction)
Storage memory >= M * spark.memory.storageFraction
Spark may evict the storage memory if required by Execution but only until total storage memory usage falls under this threshold defined by spark.memory.storageFraction. Default value of spark.memory.storageFraction is 0.5.
One of the common exceptions related to memory is – ‘ExecutorLostFailure Reason: Container killed by YARN for exceeding memory limits. 2.5 GB of 2.5 GB physical memory used. Consider boosting spark.yarn.executor.memoryOverhead’
Memory overhead is the amount of off-heap memory allocated to each executor. Memory overhead is used for buffers and thread stacks. By default, it is set to either 10% of executor memory. You can try to increase this but it should respect the equation above i.e. (spark.executor.memory + spark.yarn.executor.memoryOverhead) *num-of-executors-per-instance < container memory.
Because this is about off-heap memory, there can be other (and better) ways to fix this like reducing executor core (since this would reduce the max number of tasks which reduces the required memory) or increasing number of partitions (since there are more partitions, amount of memory required per partition is less) or increasing executor memory (since this value is a factor of executor memory, increasing executor memory would increase memory overhead).
Another most common exception related is OutOfMemory, which can happen for various reasons like misconfiguring the clusters — over utilising the memory, objects persisted only in memory not spilling on disk, too much shuffling or insufficient user memory. For example, you are doing heavy processing in your application like image processing or something, you might want to decrease spark.memory.fraction to give more to user memory.
Good reads
https://spark.apache.org/docs/latest/tuning.html#memory-management-overview
Dynamic resource allocation
As you can see, configuring your cluster properly requires a bit of maths and if our workload is changing something elastic would be better. Dynamic resource allocation simplifies this for you. It adapts resources used in processing according to the workload. You can control this through configuration parameter spark.dynamicAllocation.enabled and other parameters that allow you to set the initial, minimum and maximum number of executors.
Good reads
https://spark.apache.org/docs/latest/job-scheduling.html#dynamic-resource-allocation
GC Tuning
Spark heavily relies on Java’s memory management and garbage collection since it can store large objects in memory.
The first step in GC tuning is to collect statistics on the frequency and execution times of the GC. This can be done passing -verbose:gc -XX:+PrintGCDetails -XX:+PrintGCTimeStamps as spark.executor.extraJavaOptions and spark.driver.extraJavaOptions in a job’s configuration. Similarly, you can set the GC type like -XX:+UseG1GC specifies that the G1GC garbage collector should be used (default is -XX:+UseParallelGC).
Spark has seen evolution in GC from the traditional memory management (heap space is divided into Young-Eden/Survivor and Old generations) — Concurrent Mark Sweep (CMS) GC and ParallelOld GC, to G1 GC (heap space divided into regions) which aims to achieve both high throughput and low pause, to project Tungsten available with higher-level APIs which aims to reduce GC by exploiting the schema knowledge of data to layout memory explicitly.
Good reads
https://databricks.com/blog/2015/05/28/tuning-java-garbage-collection-for-spark-applications.html
K. Shanmugam in his blog above compares memory usage with CMS GC and G1 GC through Ganglia as:
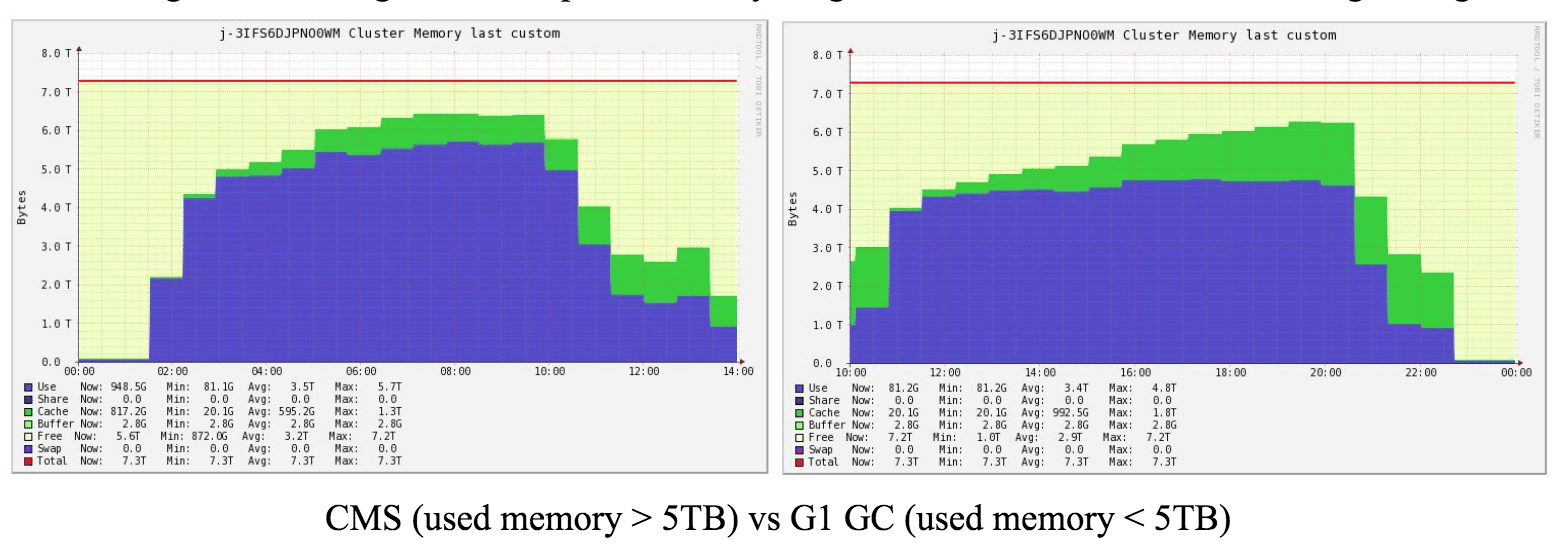
From oracle: In the case of G1 GC, the heap is partitioned into a set of equal-sized heap regions, each a contiguous range of virtual memory. Certain region sets are assigned the same roles (Eden, Survivor, Old) as in the older collectors, but there is not a fixed size for them. This provides greater flexibility in memory usage. G1 tracks the liveliness of objects in the region (‘remembered set’) and concentrates its collection and compaction activity on the areas of the heap that are likely to be full of reclaimable objects, that is, garbage. This makes pauses much controlled.
A problem with G1 GC is ‘humongous objects’ — any object that is more than half a region size is considered a humongous object. If you see back-to-back concurrent cycles initiated due to Humongous allocations a probable fix is to increase -XX:G1HeapRegionSize such that previous Humongous objects are no longer Humongous and will follow the regular allocation. My colleague, Yash Datta, talks more about fine-tuning with G1 GC here.
Until Java 1.8u40, the reclamation of humongous regions was only done during full GC events. This was fixed or improved in later releases https://bugs.openjdk.java.net/browse/JDK-8027959 so the impact of the issue has been reduced significantly for newer JVMs.
Bad code and related problems
There are these brilliant slides ‘Everyday I’m Shuffling’ by Holden Karau and Vida Ha from Databricks which I guess every spark engineer must-read for tips to write better Spark programs. I am listing here the very common problems we faced which may or may not be covered here, skipping the details if they are already covered.
Avoid shuffle (we know this but we still do!)
Use built-in functions and avoid unnecessary collect. collect() sends all the partitions to the single driver which can cause OOM errors.
Some preferred methods: ReduceByKey over GroupByKey
As ReduceByKey combines data before shuffling, therefore minimizing the amount of data transferred over the network compared to GroupByKey. GroupByKey most of the time causes of out of disk problems.
Avoid serialization of the whole object
Avoid serialization of the whole object due to references in closures passed to transformation functions (map, flatMap, filter, etc) or while broadcasting a variable. When you apply such transformations, your transformation code or closure is:
- Serialized on the driver node
- Shipped over the network to the worker nodes
- Deserialized
- Executed on each partition independently
For example, the code below will fail since it will try to serialize Executor (which is not Serializable), it would throw SparkException: Task not serializable Caused by java.io.NotSerializableException.
val rdd: RDD[String] = …
object Executor {
 def bc = sc.broadcast(map)
 rdd.map(bc.value.get)
}
Another common example:
object Executor {
 def f (log: String): String = log.stripSuffix(“”)
 val sample = rdd.map(f(_))
}
To fix this, you would tend to make your class Serializable. It would work but may not be desirable since you want to be serializing as little as possible. A better solution could be:
- Use your function as a first-class citizen if it is possible.
object Executor {
 rdd.map(_.stripSuffix(“”))
}
2. Instead of def, use val function and enclose it in a function or block so it wouldn’t need to serialize the whole object because it can access everything required the scope of the block.
object Executor {
 val xyz = …
 val block = {
   val f: String => String = (log: String) => log.stripSuffix(“”)
   rdd.map(f(_))  }
}
3. Put it into a companion object which is Serializable.
class Executor {
 val xyz = …
.. }
object Executor extends java.io.Serializable {
 def f (log: String): String = log.stripSuffix(“”)
}
val block = rawRDD.map(f(_))
Operations reordering
If you are using RDD, then the reordering of operations can improve speed. However, if you are using higher-level APIs, the catalyst query optimizer automatically optimizes.
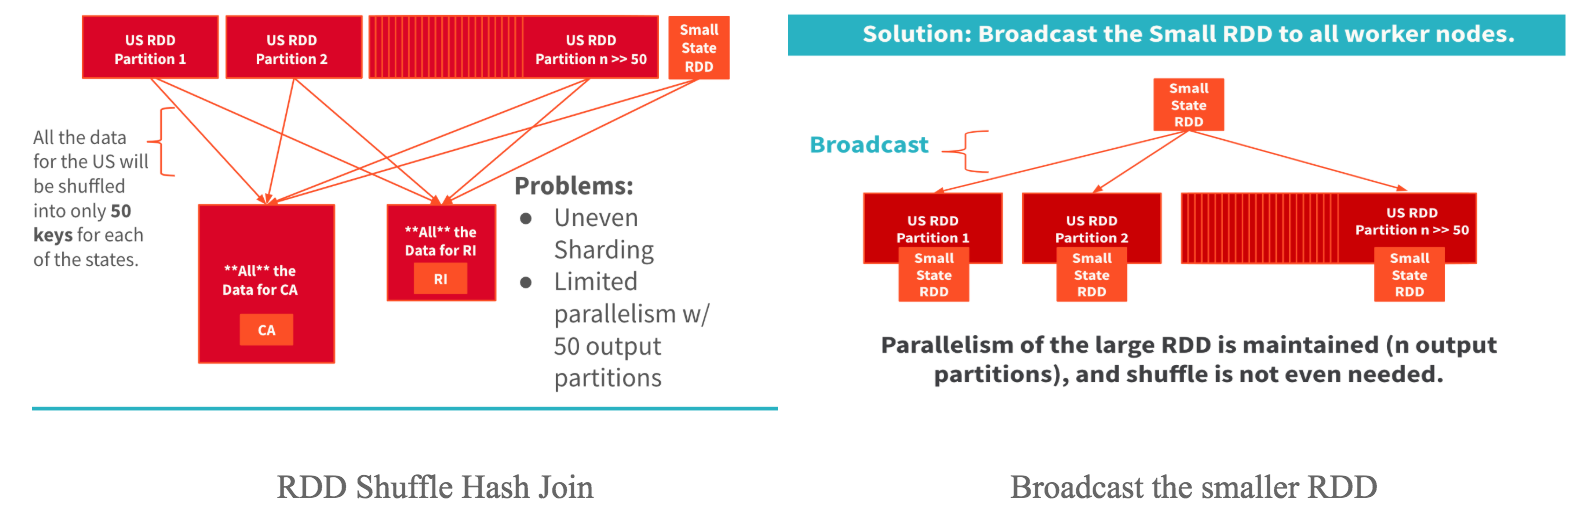
Improve Joins
- Using Broadcast variable (Joining very large datasets with a relatively small dataset)
Taking an example from the slides above: Join the dataset ‘people_in_the_us’ (large RDD) with ‘states’ (small RDD). There are only 50 keys in ‘state’, all the people data is shuffled to only these 50 keys (first figure) leading to uneven sharding and limited parallelism. Even larger clusters won’t solve this problem. Instead, if you broadcast the ‘state’ dataset to all the workers, you can avoid these problems.
If you are using RDD, you have to explicitly broadcast, for example:
val bc = sc.broadcast(smallRdd.keyBy(_.id).collect.toMap
largeRdd.map (bc.value.get(_.id))
If you are using dataframe, broadcast joins are done automatically. Config parameter spark.sql.autoBroadcastJoinThreshold and a broadcast hint is used used to control broadcast and therefore affects the performance of your job.
val df1 = spark.range(1000)
val df2 = spark.range(1000)
df1.join(df2, Seq(“id”)).explain
== Physical Plan ==
*(2) Project [id#0L]
+- *(2) BroadcastHashJoin [id#0L], [id#2L], Inner, BuildRight
:- *(2) Range (0, 1000, step=1, splits=8)
+- BroadcastExchange HashedRelationBroadcastMode(List(input[0, bigint, false]))
+- *(1) Range (0, 1000, step=1, splits=8)
A common exception related to broadcast joins is java.util.concurrent.TimeoutException: Futures timed out after [300 seconds]
This could be because of the large size of the dataset being broadcasted and taking too much time because of the size. You can try disabling broadcast by setting spark.sql.autoBroadcastJoinThreshold to -1 or increasing the broadcast time through spark.sql.broadcastTimeout (defaults to 5 minutes).
Try it out yourself! Re-run the above example with:
spark.conf.set(“spark.sql.autoBroadcastJoinThreshold”, -1)
df1.join(df2, Seq(“id”)).explain
- Using filters pre-join (Joining very large datasets with a mid-sized dataset)
Joining the dataset ‘people_in_the_us’ (large RDD) with ‘people_in_california’ (mid-sized RDD) will shuffle everything! This can be optimized by the trick to filter out the rows from California in ‘people_in_the_us’ before the join, to reduce the size of data shuffled.
Degree of parallelism
To tune your job to use the cluster fully, it is important to understand how the data gets distributed over the cluster or how many partitions does an RDD represents.
Spark manages data through partitions which helps in parallelizing the distributed data processing with minimal network traffic for sending data between the executors.
Spark can create distributed datasets from any storage source supported by Hadoop, including your local file system, HDFS, Cassandra, HBase, Amazon S3, etc. Spark supports text files, SequenceFiles, and any other Hadoop InputFormat. How Spark would distribute data read from these storage depends on the partitioning scheme in these storage and locality.
For example, if you are reading data from HDFS, by default, a partition is created for each HDFS block, which (by default) is 64MB. While if you run Spark in local mode, by default the number of partitions is the number of available cores. Also, the spark connectors for these databases would take locality into account. For example, if Spark and Cassandra are on the same physical machine, the spark-cassandra-connector will ensure data locality for both reads and writes. If you load a Cassandra table into an RDD, the connector will always try to do the operations on this RDD locally on each node and when you save the RDD into Cassandra, the connector will also try to save results locally.
RDDs get partitioned automatically, without programmer’s intervention. However, there are times when you would like to adjust the size and number of partitions or the partitioning scheme according to the needs of your application.
- Repartition: is used when the default number of partitions is too less and you want to increase or data is inconsistently distributed. Partition would perform a full shuffle. You can pass the ‘number of partitions’ as a parameter while reading the data or use repartition(n). Factors to consider to estimate the ideal number of partitions:
Cores: A rough estimate for the number of partitions could be 2 x (number executors x numbers of cores per executor). You can start from here and try finding the optimal number of partitions.
Task input size: You should check how much is the task input size, normally it should ideally be 128 MB. If it is bigger, you might want to experiment by adding more partitions.
- Coalesce: is used when you want to decrease the number of partitions with minimal shuffle. Often use while writing data to databases to reduce the parallelism. coalesce(n, flag) accepts ‘number of partitions’ and ‘shuffle’ boolean parameter. repartition(n) calls coalesce(n, flag=true).
One important point to take note of while coalescing is that it affects the upstream processing parallelism in case you are avoiding a shuffle by using coalesce. This means that rdd.map(f).coalesce(5) will force the processing of map over f to just 5 tasks even if the RDD had 100 partitions before.
Tuning partitions is one of the most common methods of optimizing Spark jobs.
More on partitioners
Spark provides two inbuilt partitioners:
- HashPartitioner: Object.hashCode method is used to determine the partition in Spark as
partition = key.hashCode % numPartitions. - RangePartitioner: If keys in your data follow a particular ordering, range partitioning is an efficient partitioning technique. In the range partitioning method, tuples having keys within the same range will appear on the same machine.
Spark also allows you to write your CustomPartitioner and pass it through partitionBy(partitioner).persist()(if you noticed persist here, it is because if you are partitioning your data, you should persist it to avoid accidental repartitioning of data). If you are doing so, one important thing to look for is that as much as possible you use the operations that propagate the partitioner, in other words, that cannot change the key.
For example map() vs mapValues() -if you applied any custom partitioning to your RDD, using map could lose that partitioner (the result will revert to default partitioning) as the keys might have changed. mapValues, however, would preserve any partitioner set on the RDD. Operations on RDDs that propagates a partitioner are:
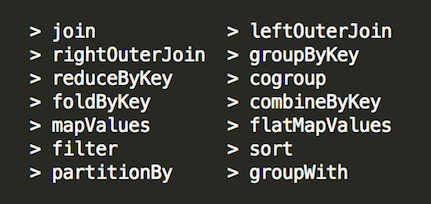
Operations on RDDs that propagates a partitioner
Good watch:
Choice of Serializer
Serialization is sometimes a bottleneck when shuffling and caching data.
- By default, Spark serializes objects using Java’s ObjectOutputStream framework, and can work with any class you create that implements java.io.Serializable.
- Kryo is significantly faster and more compact than Java serialization (often as much as 10x). Kryo requires you to register every class you are going to use, this lets Kyro avoid to write the name of the class along with every object which is one of the largest overhead in serialization.
However, Datasets’ encoders are considered to be much faster compared to serialization/deserialization via Java/Kryo.
Good reads:
Apache Spark Datasets https://databricks.com/blog/2016/01/04/introducing-apache-spark-datasets.html
Tuning Spark https://spark.apache.org/docs/latest/tuning.html#data-serialization
Dedicated Spark local directories
Spark writes intermediate output files from map tasks, shuffles and data that gets stored to disk to a temporary directory or ‘scratch’ space. It is set through spark.local.dir or yarn.nodemanager.local-dirs in yarn mode, which by default is /tmp. /tmp is used by the operating system so it might get filled up very quickly which can lead to exceptions like java.io.IOException: No space left on device.
In such cases, if you may notice that the ‘Shuffle write’ is huge, meaning there is a lot of movement in data, implying ‘scratch’ might be used heavily, can get above exception. Increasing the scratch space might fix your problem.
Spark recommends this directory to be fast, local and if possible dedicated. You can also pass a list of directories to this parameter.
EMR provides a simple interface to add volumes to nodes in your cluster. For example, here I have added two volumes to my core instance:
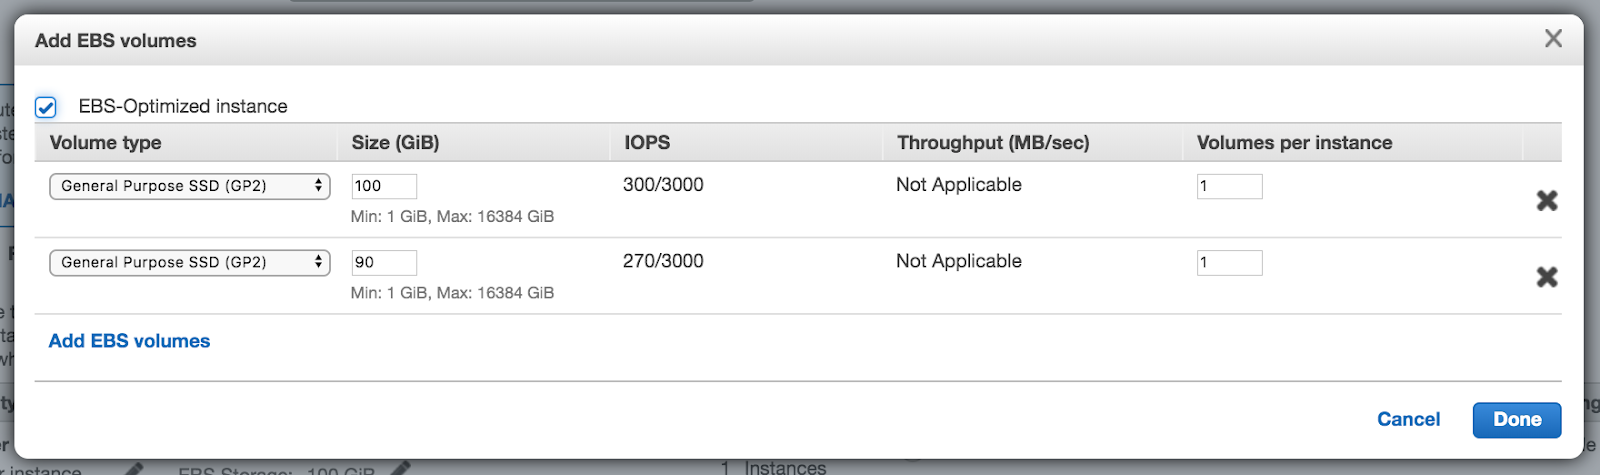
Mounted as:
Filesystem Size Used Avail Use% Mounted on
/dev/xvdb2 95G 857M 95G 1% /mnt
/dev/xvdc 90G 425M 90G 1% /mnt1
If you check yarn-site.xml, you will see ‘yarn.nodemanager.local-dirs’ is already set to ‘/mnt/yarn,/mnt1/yarn’.
Writing to databases
Normally you would initialize the Database Connection on the Worker rather than the Driver since network sockets are non-serializable. When persisting an RDD to a database, connections should be initiated on each partition (foreachPartition) rather than in the driver or for each entry (which would fail due to too many connections or extremely slow).
Your connector should be writing in batches, you can tune the parameters related to it like batch size, the number of parallel writes, etc.
Prefer the connectors which are ‘locality aware’ so it can reduce the data movement based on the placement of your Database and Spark instances
Data storage formats & compression options
Parquet
Parquet is a columnar format that automatically preserves the schema of the original data. Also, this format is supported by many other data processing systems. It can save both time and space since it enables the jobs to read a smaller fraction of the data which is required for the calculation
due to push-down filters and default compression, snappy, it comes with. Apart from compression, parquet uses many different encodings for different data types which you can read about here
Since Parquet files require a schema, if you are using RDDs, you would normally convert your RDD to Dataframe. RDDs are not required to have schema but Dataframes must-have.
val df = rdd.toDF() // convert RDD to Dataframe
df.write.parquet(<filepath>) // save as parquet
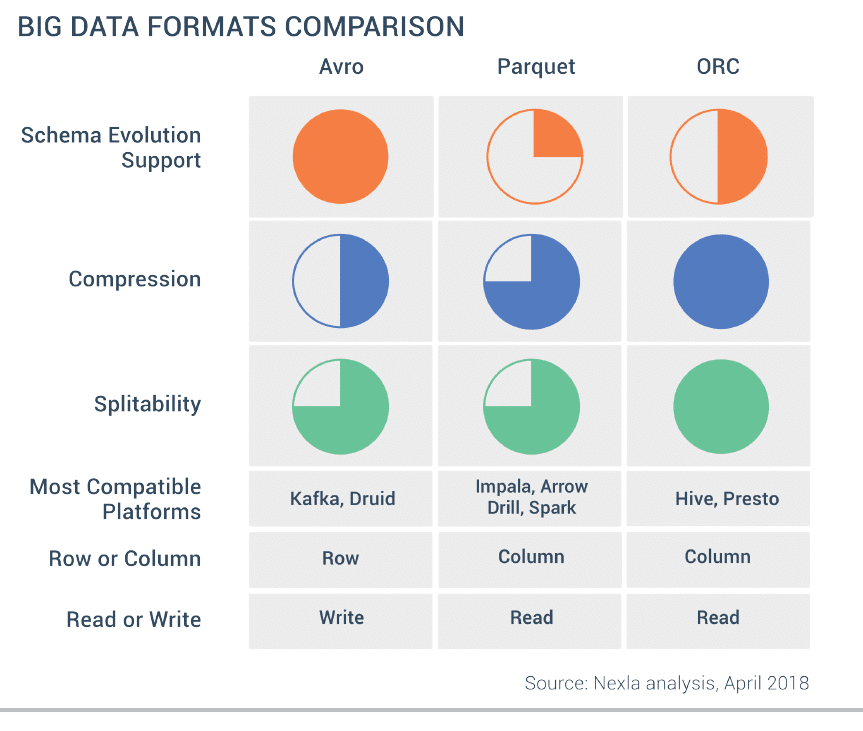
ORC
ORC is also a columnar like Parquet but in some cases, also as per our benchmarks with Presto, can outperform Parquet. Here is a comparison by Nexla of common data formats.
Databricks Delta
We are still exploring this but Delta looks very promising especially for ML workloads since over the usual Parquet format, it adds transactional properties to your data and makes versioning and rollbacks possible, this allows you to reproduce your ML experiments. It can be called as ‘super parquet’ format.
Compression Options
This slide from Yahoo! nicely summarises the popular compressions.
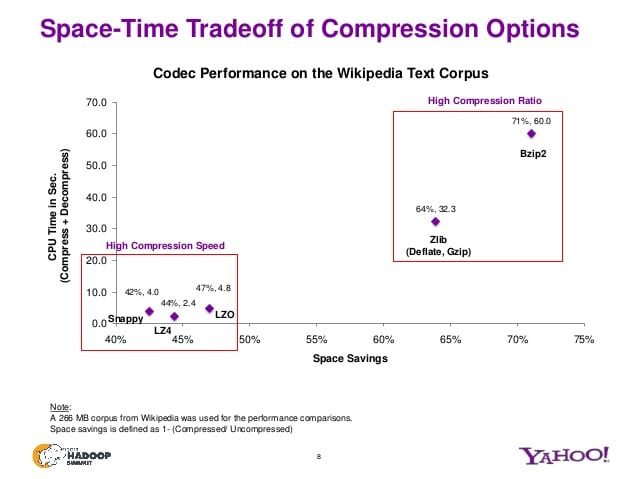
Good read
Compression options -Yahoo! -https://www.slideshare.net/Hadoop_Summit/singh-kamat-june27425pmroom210c
Caching intermediate datasets
Available levels:
- MEMORY_ONLY (default) — deserialization, fast scanning (in runtime) but worse for GC pressure because you have random objects sitting around inside of cache.
- MEMORY_ONLY_SER stores as serialized Java objects (one byte array per partition). This can help cut down on GC, space-efficient than deserialized objects but more CPU-intensive to read.
- MEMORY_AND_DISK avoids expensive recomputation. If the RDD does not fit in memory, at least it would be in the disk and you won’t have to repeat the expensive computation.
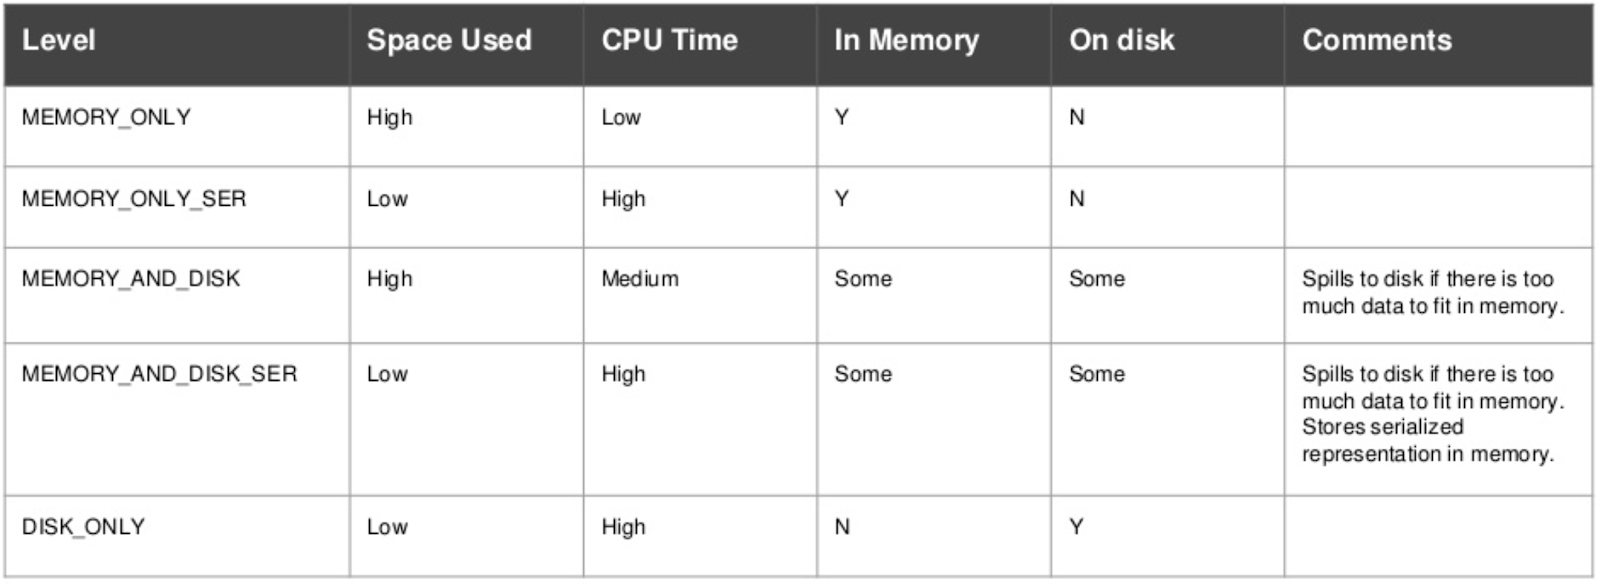
To my surprise, this was the simplest and most effective method for us to gain performance. Some of our jobs ran six times faster after changing the persistence from default to MEMORY_AND_DISK_SER! That is because, in the case of MEMORY_ONLY caching if allowed storage memory is full, blocks are evicted for the newer blocks to be cached. But with MEMORY_AND_DISK, cached blocks are simply spilled over to disk without evicting any cached blocks.
Use higher-level APIs
If your data is structured or semi-structured, it is better to use Dataframes/Datasets which not only provides higher-level abstraction, richer semantics, type-safety at compile-time, columnar access etc but also better space and speed efficiency which is mainly due to following optimizations:
Tungsten: which substantially improves the memory and CPU efficiency. It uses the knowledge of data schema to directly lay out the memory explicitly. As a result, Tungsten Encoders can efficiently serialize/deserialize JVM objects as well as generate compact bytecode that can execute at superior speeds.
Catalyst query optimizer: which can do optimizations like reordering of operations or reducing the amount of data that must be read for a calculation.
Good reads:
A Tale of Three Apache Spark APIs https://databricks.com/blog/2016/07/14/a-tale-of-three-apache-spark-apis-rdds-dataframes-and-datasets.html
Power of Datasets https://databricks.com/blog/2016/01/04/introducing-apache-spark-datasets.html
Project Tungsten and Catalyst SQL optimizer https://medium.com/@goyalsaurabh66/project-tungsten-and-catalyst-sql-optimizer-9d3c83806b63
These are the basic concepts you must know to continuously optimize and scale your jobs on production, irrespective of whether you are working with RDDs or SparkSQL or higher-level APIs, which now does many optimizations under the hood and recommended but knowing fundamentals always helps. I still refer to these notes from time to time to refresh.
If you happen to reach the end of this article to read this, I will be happy to hear your feedback.

Written by Dan Turner
Product Manager and Business Developer at Streamhub